I have been working for a while now on bringing together some very interesting topics. Machine learning/data analysis tools and the platform I like: SmartOS with it’s great DTrace tooling. This is a first post on this topics with some very early results ![]()
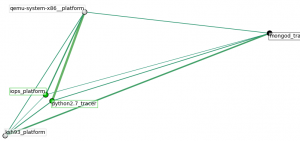
The following graph shows the dependencies between some processes (got way more in my dataset). The ones with ‘*_tracer‘ run within a zone. Whereas the ‘*_platform‘ are coming from the global SmartOS zone. To make it more complete also I/O of the platform are taken into account, so we do not just look at the processes. The graph shows the ‘links’ between the processes (e.g. python) & other data sources (iops):
What happened within the time-frame of the training data was that another zone with an KVM VM instances got started, hence the ‘qemu‘ process running. First a cluster analysis was used to see the rough interdependence of the sources. The edges express the ‘strength’ of an link between data sources – this was inspired by this.
You can see that the start of a VM leads to some I/O operations, logically. The python process you can see has a strong link to the qemu process for no particular reason. This is because it was collecting data using the DTrace consumer. So it just happens that is was very active while the KVM got started. As said this is a first shot. Certainly the selection to which data sources to look at needs to be optimized. Plenty of possibilities there since I used DTrace to gather a fair amount of data.
Also it will be interesting to look at different application setups. This was data gathered during a VM start up. First experiments while looking at web severs (the httpd process and incoming tcp connections) already bring up different graphs. So why is this cool? When an machine can learn the behavior (graphs like above) it can identify misbehavior based on new incoming data from a DTrace probes. Also this could be used to tune the setup & configurations of a system.
Again these are very early results – just got excited and wanted to post something ![]() Definitely the cluster analysis which is carried out needs to be tuned as well.
Definitely the cluster analysis which is carried out needs to be tuned as well.
What was used to get this done:
- Python & DTrace
- SmartOS
- MongoDB & sqlite
- scikit-learn and matplotlib
- plenty of time
![:-)]()
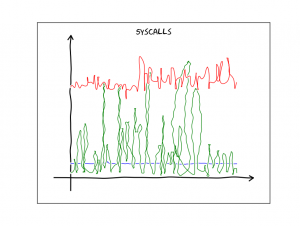
And just for fun since I discovered this nice XKCD plotting extension to matplotlib – a graph which show the # of system calls per process over time in xkcd ’style’:

