Note: this is mostly just for proof of concept – not necessarily something you want to do in a production system, but might be useful in a staging/test environment.
Functions in a Serverless environment (Tim Bray has a nice write-up of some of the key aspects of Serverless here. And let’s leave aside some side notes like this one.) like OpenFaaS or OpenWhisk are short lived things that really come and go. But wouldn’t it be useful to – regardless of this context – to be able to gain insight on how your functions perform? Hence being able to trace/profile the functions in an environment would be a nice to have add-on.
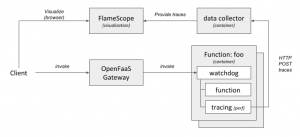
The following diagram shows a high-level overview of how this could look like.
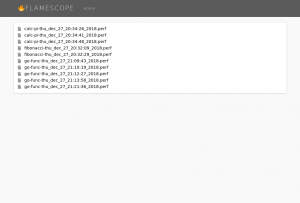
Once you have the tracing/profiling of your functions in place FlameScope is a handy tool to visualize them. Here you can see the list of trace for previously executed functions:
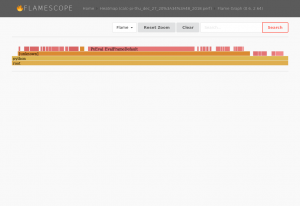
Drilling deeper into them you can see the actually FlameGraphs of each function – for example a function calculating pi.
As some functions have a very short lifespan, you will also note – that by looking at the heatmaps – not a lot is going:
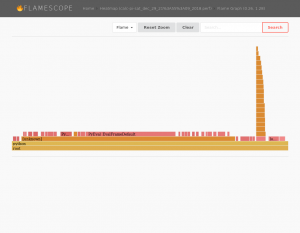
I’m not necessarily claiming this is all very useful – especially since some functions are still very short lived, and their traces are not capturing a lot of information, therefore. However the general concept of all this sounds intriguing to me. Running your function on different platforms for example will results in difference in the FlameGraph. The function shown here will calculate Pi and perform some I/O operations for test purposes. The function’s FlameGraph from above looks a bit different when run on a different platform (Xeon vs i5):
Multiple runs of the same function on the same platform will results in similar FlameGraphs.
The following sections describe how to enable such a scenario:
Step 1) enabling the environment
Frameworks such as OpenFaas or OpenWhisk will use docker [cold|warm|hot] containers to host the functions. So one of the initial steps it to enable tracing in those containers. By one some syscalls are blocked – for good reason – in docker [src]. Unless you want to go dig deep into OpenFaaS or OpenWhisk and change how they run containers, the easiest way forward it to enable e.g. the perf_event_open system call using seccomp security profiles system wide. To do so start dockerd with the following parameters:
$ sudo dockerd -H unix:///var/run/docker.sock --seccomp-profile /etc/docker/defaults.json
An example security profile can be found here. Just whitelist the right system calls that you will need and store the profile in /etc/docker/defaults.json. For this example we will user perf, hence we need to enable perf_event_open.
Note: another option (almost more elegant & more secure) would be to trace the functions not from within the container, but on the host system. perf does allow for limiting the cgroup and hence doing this (through the option –cgroup=docker/…) , but this would yet again require some more integration work with your framework. Also note that although perf does not add a lot of overhead for instrumentation, it also does not come “for free” either.
Step 2) plumbing
As we will trace the functions from within their containers, we need to get the data out of the containers. A simple python HTTP service that allows for POSTing traces to it, will also store the same into files in a directory. As this service can be run in a container itself, this directory can easily be mounted to the container. Now within each container we can simply post the data (in the file trace.perf) to the data collector:
$ curl -X POST http://172.17.0.1:9876/ -H 'X-name: go-func' --data-binary @trace.perf
Step 3) altering the templates
The easiest way to kick of the tracing command perf, whenever a function is executed is by altering the template of your framework. For OpenFaaS your can easily pull the templatest using:
$ faas-cli template pull
Once they have been pulled the easiest thing to do is to alter the Dockerfile to include a shell script which executes e.g. your perf commands:
#!/bin/sh

perf record -o perf.data -q -F 1004 -p $1 -a -g -- sleep 5
perf script -i perf.data --header > trace.perf
curl -X POST http://172.17.0.1:9876/ -H 'X-name: fibonacci' --data-binary @trace.perf
Note that in this example we use perf to instrument at a frequency of 1004 Hz – just offsetting it from 1000 Hz to make sure we capture everything. It might make sense to tweak the frequency according to your environment – 1000 Hz is already providing a lot of detail.
Also we need to alter the Dockerfiles to a) install the perf tool and b) ensure we can execute it with the user app:
...
RUN apk add curl sudo
RUN  apk add linux-tools --update-cache --repository http://dl-3.alpinelinux.org/alpine/edge/testing/ --allow-untrusted

# Add non root user
RUN addgroup -S app && adduser app -S -G app wheel
RUN adduser app wheel
RUN echo '%app ALL=(ALL) NOPASSWD:ALL' >> /etc/sudoers

WORKDIR /home/app/

# ensure we copy the trace file over as well.
COPY trace.sh           .
...
Also make sure that this shell script will get call whenever your function is triggered. For example in the python templates alter the index.py file, for e.g. golang edit the main.go file. Within those just execute the shell script above with the PID of the current process as the first argument
Step 4) visualize it
FlameGraphs are pretty handy, and a team @ Netflix (including Brendan Gregg) have been busy writing a handy tool to visualize the traces. FlameScope can easily be executed using a docker command:
$ docker run --rm -it -v /tmp/stacks:/stacks:ro -p 5000:5000 flamescope
Note: that I had to do some minor tweaks to get FlameScope to work. I had to update the Dockerfile to the python3 version of alpine, manually add libmagic (apk add libmagic), and don’t forget to configure FlameScope to pickup the profiles from /stacks in config.py.
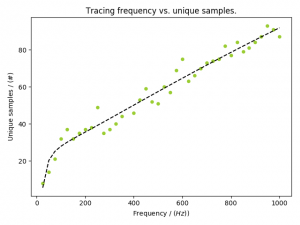
Update [2019/01/08] Originally I traced the functions with a frequency of 1004 Hz. This seems to be a bit high. As you can see in the following graph – and read this as a rule of thumb, not necessarily the ground truth – sampling at about 200 Hz will give you the necessary information:
